目录
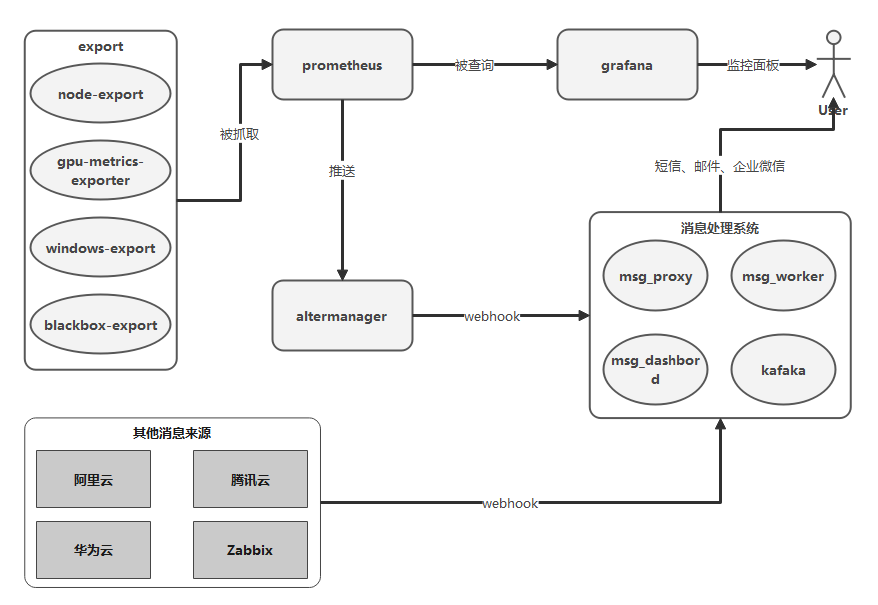
整体架构
Export Metrics
- node-export
- gpu-metrics-export
- windows-export
- blackbox-export
Prometheus
官方文档:https://prometheus.io/docs/prometheus/latest/getting_started/
热加载配置:
1
2
3
4
5
6
7
8
9
10
11
12
# 1.启动命令添加命令行
--config.file=/etc/prometheus/prometheus.yml \
--web.enable-admin-api \
--web.enable-lifecycle

# 2.使用curl请求
curl -X POST http://192.168.20.75:9898/-/reload

# 3.其他api
GET /-/healthy
GET /-/ready
POST /-/quit
Prometheus配置
1 主配置文件: prometheus.yml
1-1 global 全局配置
1
2
3
scrape_interval:抓取间隔
evaluation_interval: 计算规则间隔
scrape_configs: 抓取配置
1-2 scrape_configs 抓取配置
1
2
3
4
5
6
7
8
9
10
11
12
13
14
15
16
17
# 基本
scrape_interval: 抓取间隔(局部)
metrics_path: 资源路径(默认:/metrics)
honor_labels:是否保留抓取来源标签(默认 false 冲突时来源标签会被重命名为exported_xxx,为 true 时标签冲突时将忽略prometheus添加的标签)
scheme: 协议(默认:http | 可选 https)
relabel_configs:target 重新标签的配置
metric_relabel_configs:metrics 重新标签的配置

# 服务发现
consul_sd_configs
dockerswarm_sd_configs
dns_sd_configs
file_sd_configs(文件列表)
kubernetes_sd_configs
openstack_sd_configs
serverset_sd_configs(Zookeeper serverset)
static_configs
file_sd_configs例子
1
2
3
4
5
6
7
8
9
10
11
12
13
14
15
[
  {
    "targets": ["192.168.220.62:9796"],
    "labels": {
      "__metrics_path__": "/metrics",
      "env": "dev",
      "project_ab": "build-cluster",
      "os": "centos",
      "service": "build-cluster",
      "service_ip": "192.168.220.62",
      "instance": "192.168.220.62:9796",
      "job": "inner-cluster"
    }
  },
]
1-3 alertmanagers 配置
1
2
3
4
5
6
7
8
9
10
11
12
13
# 基础
timeout(默认10s)
api_version(默认v1)

## 服务发现
consul_sd_configs
dockerswarm_sd_configs
dns_sd_configs
file_sd_configs(文件列表)
kubernetes_sd_configs
openstack_sd_configs
serverset_sd_configs(Zookeeper serverset)
static_configs
1-4 例子
1
2
3
4
5
6
7
8
9
10
11
12
13
14
15
16
17
18
19
20
global:
  scrape_interval: 30s
  evaluation_interval: 30s
  scrape_timeout: 30s
  external_labels:
    monitor: 'codelab-monitor'

scrape_configs:
  - job_name: 'ops-dev'
    file_sd_configs:
    - files:
      - monitor-ops-etc.json

rule_files:
  - local-vm-rules.yml

alerting:
  alertmanagers:
    - static_configs:
        - targets: ['192.168.20.75:9093']
2 规则配置文件 local-vm-rules.yml
2-1 规则语法检查
1
2
3
4
5
go get github.com/prometheus/prometheus/cmd/promtool
promtool check rules /path/to/example.rules.yml

# 测试规则,测试文件参考官方文档
promtool test rules test.yml
2-2 recording rules
可以预先计算经常需要或计算量大的表达式,并将其结果保存为-组新的时间序列。
这样,查询预先计算的结果通常比每次需要原始表达式都要快得多。
这对于仪表板尤其有用,仪表板每次刷新时都需要重复查询相同的表达式。
1
2
3
4
5
groups:
  - name: example
    rules:
    - record: job:http_inprogress_requests:sum
      expr: sum by (job) (http_inprogress_requests)
2-3 alerting rules
触发报警的规则
1
2
3
4
5
6
7
8
9
10
11
12
13
14
15
16
17
18
19
20
21
22
23
24
25
# for 这里表示第一次报警后 5m 内处于 pending 的状态。
# 若中间检查 expr 只要有一次正常则重新计算 5m
# 若 5m 内一直是报警状态,则更改状态为 firing 触发报警。
#
# labels 可以重写来源标签,并且可以使用 templated。
#
# annotations 可以用来存储更长的标签信息,并且可以使用 templated。
#
# Templating
## ${labels} 存储标签键值对,可以使用 {{ $labels.\<labelname\> }} 来获取某个标签的值
## ${value} 存储 expr 计算出来的值

groups:
- name: linux-rules
  rules:
  - alert: InstanceDown
    expr: up{os!='windows'} == 0
    for: 5m
    labels:
      severity: critical
      service: "{{ $labels.mountpoint }}"
    annotations:
      value: "{{ $value }}"
      summary: "Instance down"
      description: "Linux网络失联"
PromQL
1 匹配模式
- 完整匹配模式:
=和!= - 正则匹配模式:
=~和!~
2 瞬时向量和区间向量
yaml
1
2
3
4
5
6
7
# 只获取最新一次样本数据
http_requests_total{}

# 获取 5m 内所有的样本数据
http_request_total{}[5m]

# 时间范围选择器的单位:s-秒  m-分  h-小时  d-天  w-周  y-年
3 时间位移
1
2
3
4
5
6
7
8
9
# 在瞬时向量表达式或者区间向量表达式中,都是以当前时间为基准
# 如果我们想查询,5分钟前的瞬时样本数据,或昨天一天的区间内的样本数据
# 就要使用到时间位移操作关键字 offset

# 例一:5m 前的瞬时样本数据
http_request_total{} offset 5m

# 例二:1d 前的所有样本数据
http_request_total{}[1d] offset 1d
4 聚合查询
1
2
3
4
5
6
7
8
9
10
11
12
13
14
15
16
17
18
19
20
21
22
23
24
25
26
27
28
# 一般使用标签过滤出来多条时间序列,PromQL提供聚合操作可以对数据进行进一步的处理

# 查询系统所有http请求的总量
sum(http_requests_total) by (instance,job)

# by 用于结果只保留标签
# without 用于结果不保留标签

# 操作符
== (相等)  != (不相等)  > (大于)  \< (小于)  \>= (大于等于)  <= (小于等于)
and(并且)  or(或者)  unless(排除)

# 聚合操作符:
sum (求和)  min (最小值)  max (最大值)  avg (平均值)  stddev (标准差)
stdvar (标准差异)  count (计数)  count_values (对value进行计数)  bottomk (后n条时序)  topk (前n条时序)  quantile (分布统计)

# 部分使用方法
# count_values 用于时间序列中每一个样本值出现的次数。
# count_values 会为每一个唯一的样本值输出一个时间序列,并且每一个时间序列包含一个额外的标签。
count_values("count", http_requests_total)

# topk和bottomk则用于对样本值进行排序
# 返回当前样本值前n位,或者后n位的时间序列
topk(5, http_requests_total)

# quantile用于计算当前样本数据值的分布情况quantile(φ, express)其中0 ≤ φ ≤ 1
# 当φ为0.5时,即表示查找当前样本数据中的中位数
quantile(0.5, http_requests_total)
5 内置函数
1
2
3
4
5
6
7
8
9
10
11
12
13
14
15
16
17
18
19
20
21
22
23
24
25
26
# 增长率
## 例子:查询 2m 内的平均增长率
increase(node_cpu[2m]) / 120
## 直接计算
rate(node_cpu[2m])
## 避免瞬间高cpu占用被计算在平均增长率而不自知的情况
## 使用 irate 来反应瞬时变化状态,有更高的灵敏度
irate(node_cpu[2m])

# 预测Gauge指标变化趋势
## 例子:根据最近的 2h 的样本数据,预测4小时后的磁盘是否用尽
predict_linear(node_filesystem_free{job="node"}[2h], 4 * 3600) < 0

# 动态标签变换
## 标签替换
label_replace(v instant-vector, dst_label string, replacement string, src_label string, regex string)
# 可使用 $1 模式匹配 instance 正则
eg: label_replace(up, 'host', "$1", "instance", "(.*):.*")
## 标签连接
label_join(v instant-vector, dst_label string, separator string, src_label_1 string, src_label_2 string, ...)
eg: label_join(up, "test", "-", "os", "env")

# 指定工作日报警
(probe_ssl_earliest_cert_expiry- time()) / 60 / 60 / 24 \< 40 and ON() day_of_week() \> 0 < 6

# 其他:https://prometheus.io/docs/prometheus/latest/querying/functions/
Grafana
官方文档:https://grafana.com/docs/grafana/latest/
看板下载:https://grafana.com/grafana/dashboards
支持报警的通道:
- 钉钉
- 邮箱
- 短信
- webhook
Alertmanager
官方文档:https://prometheus.io/docs/alerting/latest/configuration/
例子文件:https://github.com/prometheus/alertmanager/blob/master/doc/examples/simple.yml
支持报警的通道:
- 邮箱
- 企业微信
- webhook
API接口
1
2
3
GET /-/healthy
GET /-/ready
POST /-/reload
配置文件
1
2
3
4
5
6
7
8
9
10
11
12
13
14
15
16
17
18
19
20
21
22
23
24
25
26
27
28
29
30
31
32
33
34
35
36
37
38
39
40
41
42
43
44
45
46
47
# 关键参数
## route
### receiver: 对应 receivers 里配置接收人列表
### group_by: 分组分批处理
### group_wait: 最初等待发送群组报警的时长
### group_interval: 同一组报警,发送一次后等待多长创建一个新的报警(避免多次创建相同组的告警信息)
### repeat_interval: 一个报警信息,等待多长时间重复发送(避免短时间重复收到同一报警消息)
### match: 全匹配
### match_re: 正则匹配
### routes: 子路由
#
## inhibit_rules: 静音规则
### source_match\<_re\>: 源标签
### target_match\<_re\>: 目标标签
### equal: 比较相等的标签值(相等则静音源标签)
#
## receivers
## [email_configs, webhook_configs, wechat_configs,...]
### send_resolved: 是否通知已解决的警报

global:
templates:
- '/etc/alertmanager/template/*.tmpl'

route:
  receiver: 'ops-webhook'
  group_by: ['alertname', 'project_ab', 'service_ip']
  group_wait: 30s
  group_interval: 5m
  repeat_interval: 6h
  routes:
  - receiver: 'ops-webhook'
    match:
      project_ab: "ops"

inhibit_rules:
- source_match:
    severity: 'critical'
  target_match:
    severity: 'warning'
  equal: ['alertname', 'project_ab', 'service_ip']

receivers:
- name: 'ops-webhook'
  webhook_configs:
  - url: 'http://xxx/ops'
    send_resolved: true
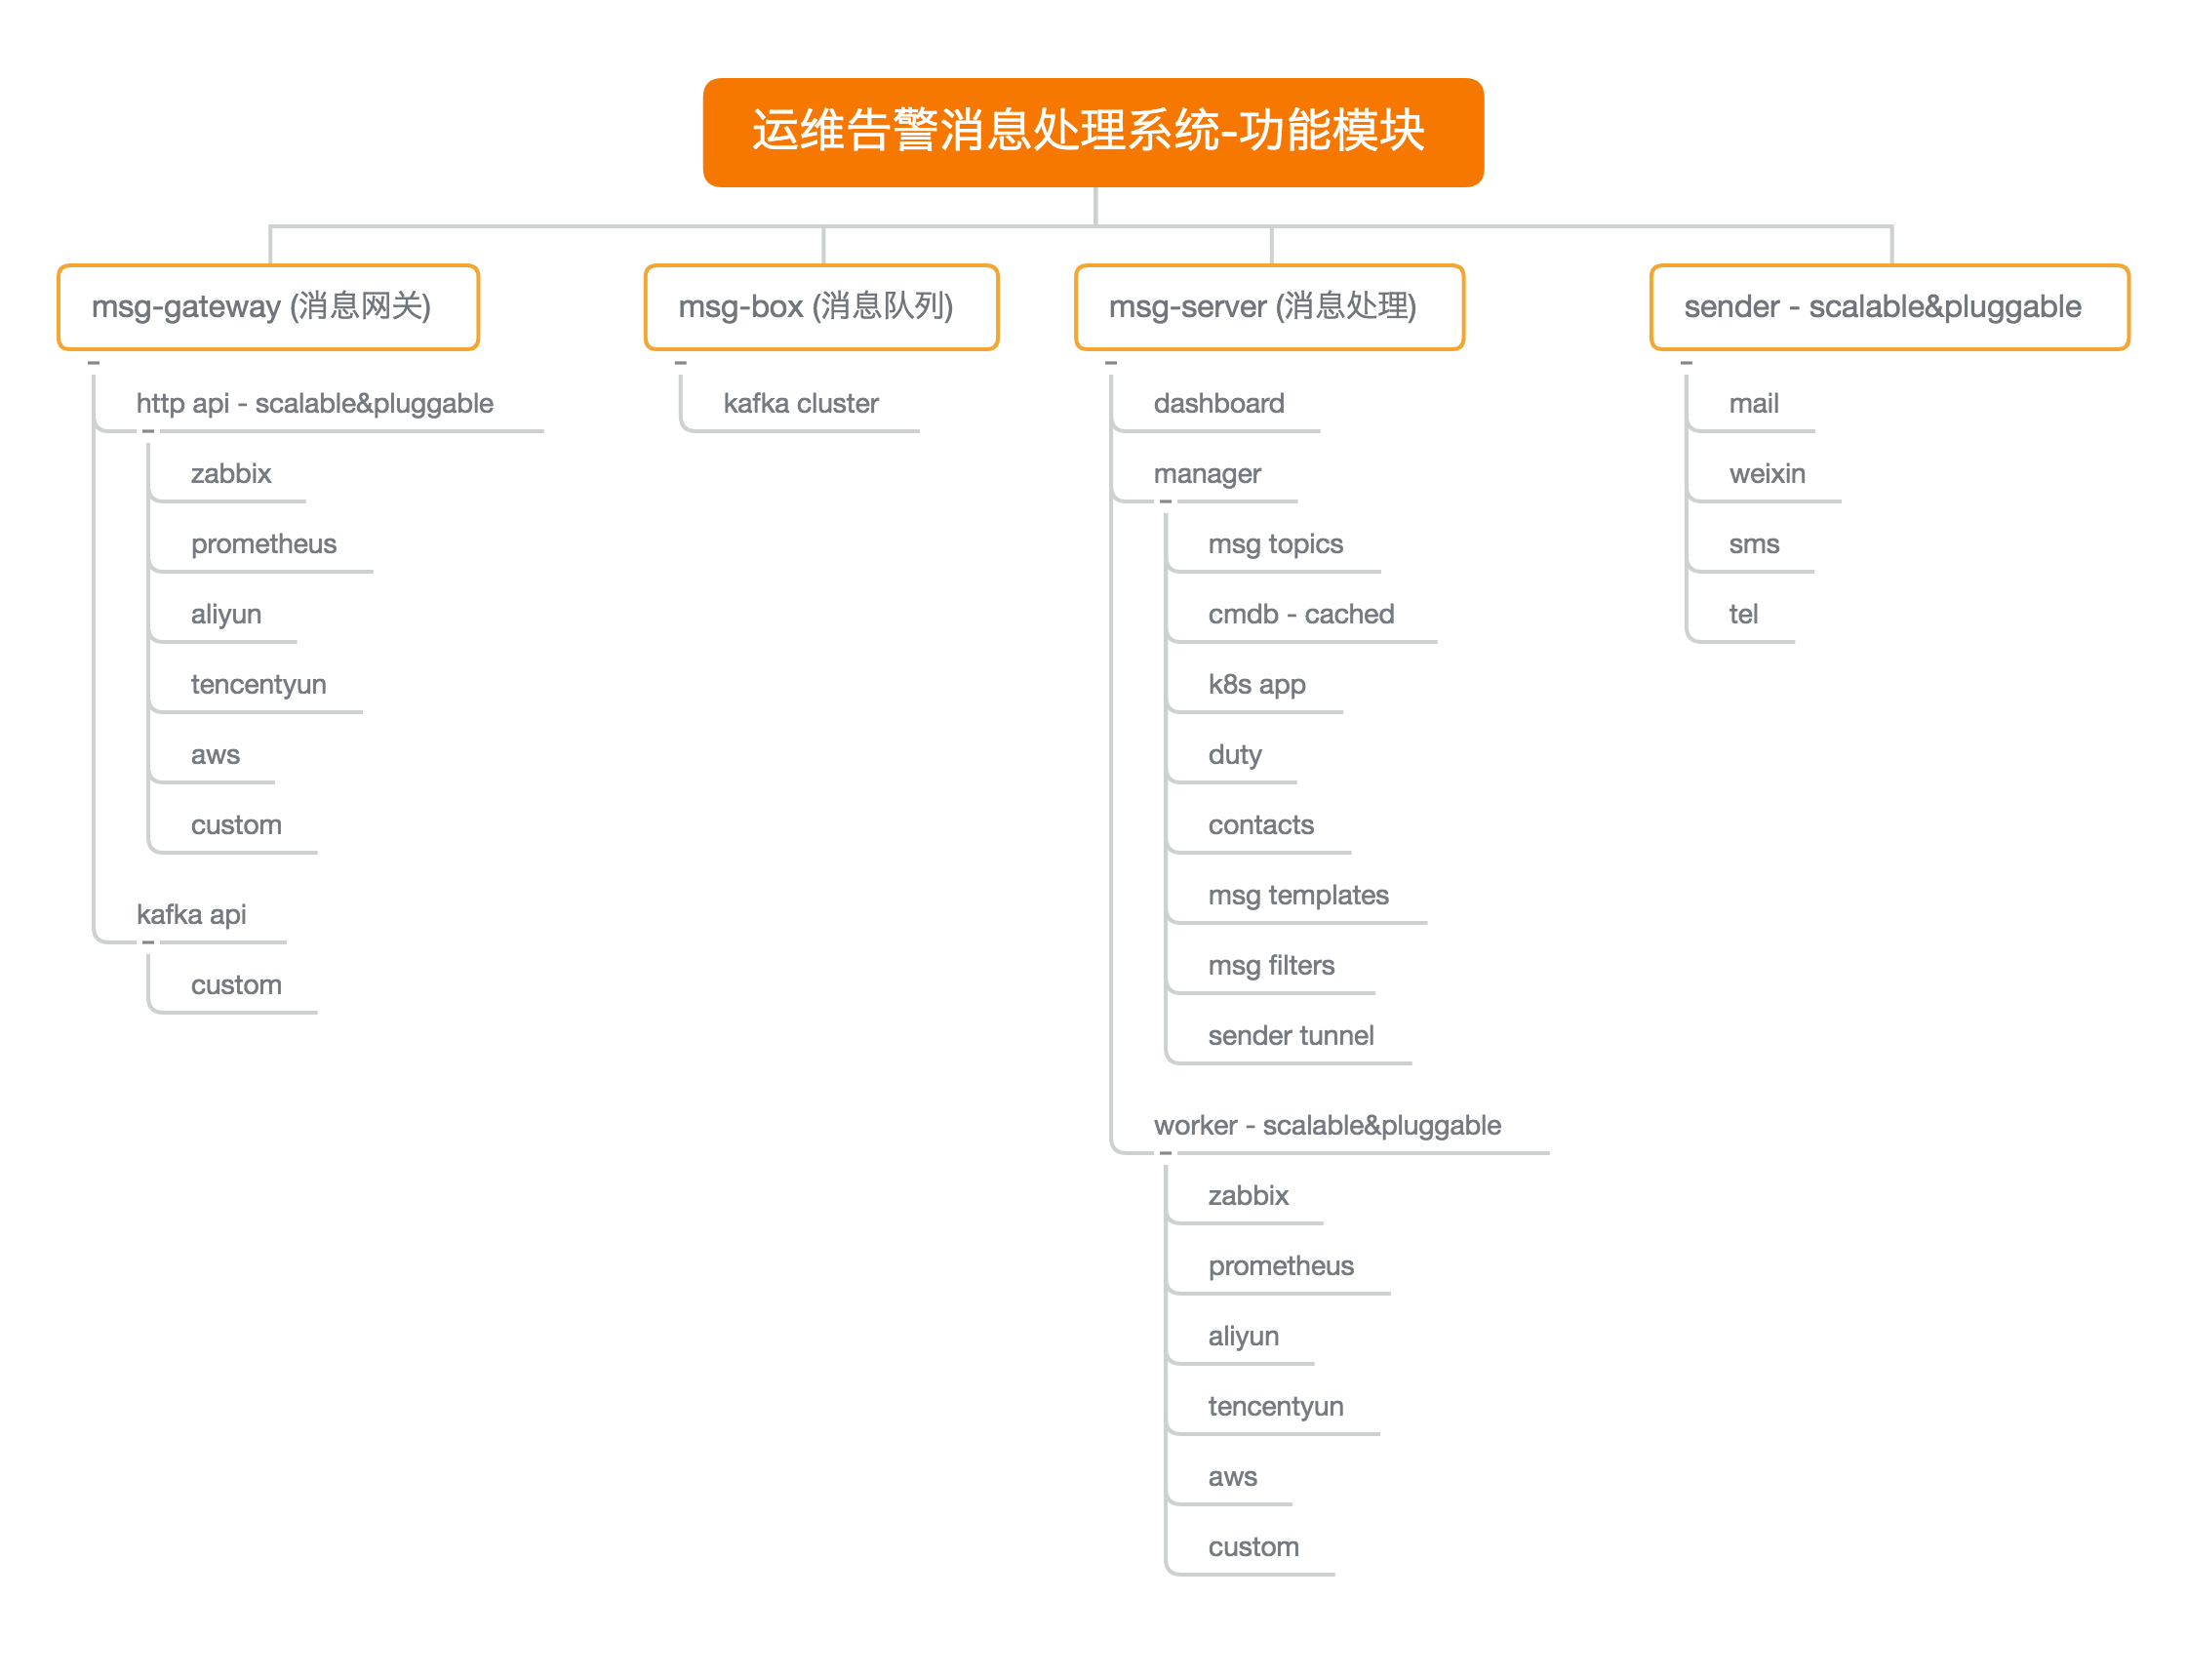
消息处理系统
功能模块
功能处理流程
